
What the $20 Trillion National Debt Means to You
By James D. Agresti
September 14, 2017
On September 8, 2017—the same day that Congress and President Trump passed a law suspending the federal debt limit until December—the official debt of the U.S. government surpassed the milestone of $20 trillion, reaching exactly $20,162,176,797,904.
To personalize that figure, it amounts to an average of $61,889 for every person in the United States, or $160,247 per household. Adjusted for inflation, these debt burdens have been larger for the past year than ever recorded in the history of the U.S.:
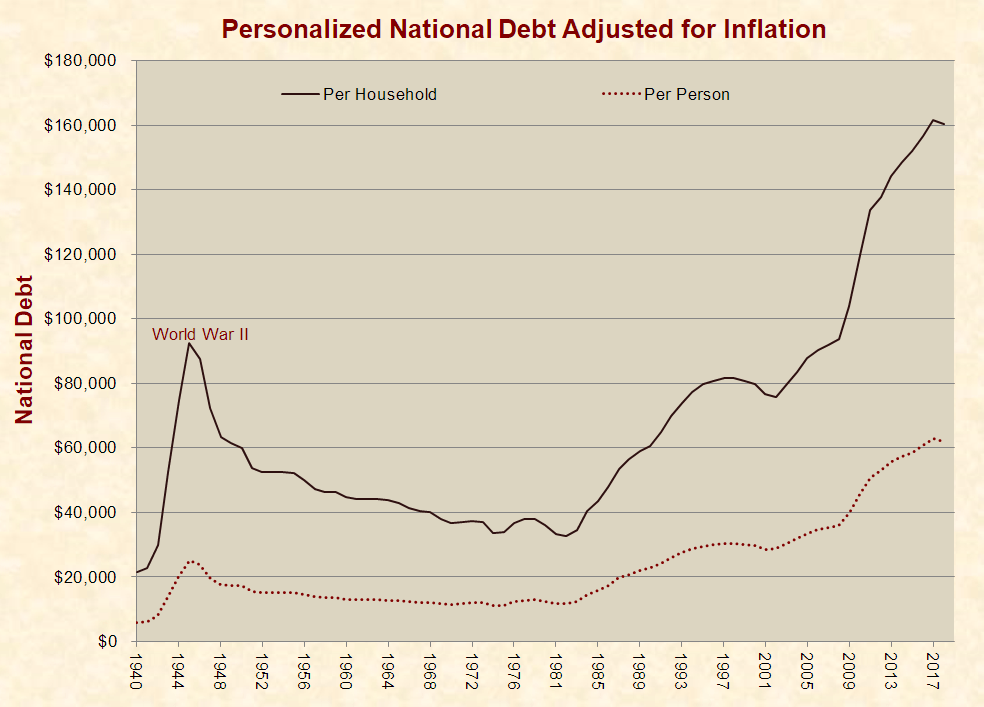 To place the per-household federal debt in another context, it is 35% higher than the average consumer household debt of $118,271, including mortgages, car loans, credit cards, and student loans.
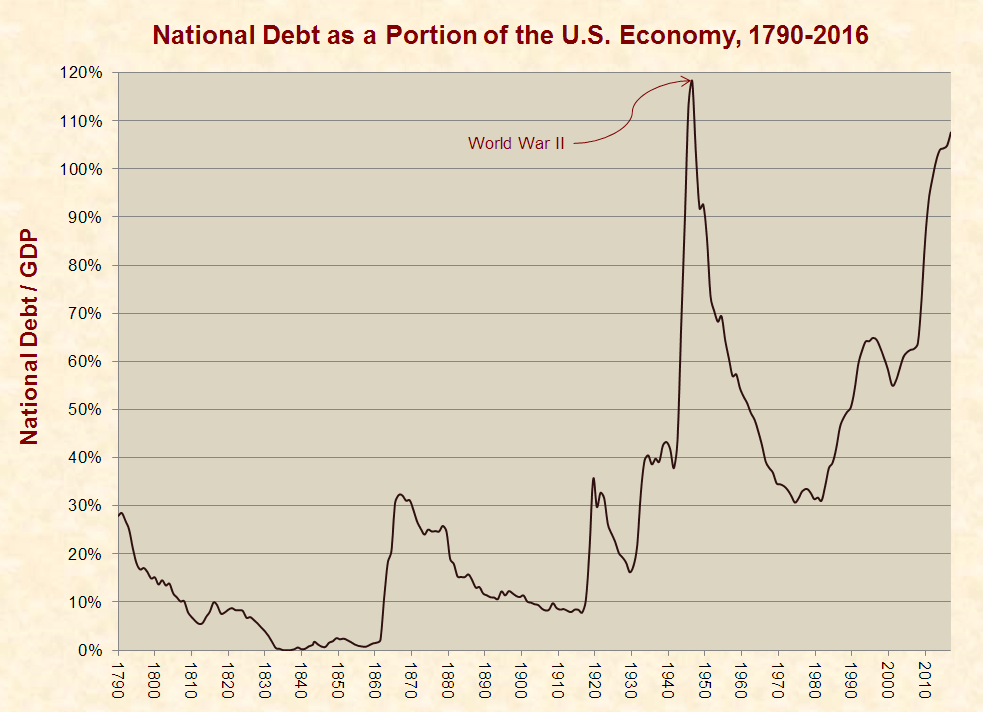
Economists often compute the national debt as a portion of the nation’s economy or gross domestic product (GDP). This is a more moderate gauge of debt in modern times, because GDP has grown faster than inflation and population. By this measure, the national debt is higher than any time in U.S. history except for a passing two-year spike at the climax of World War II:
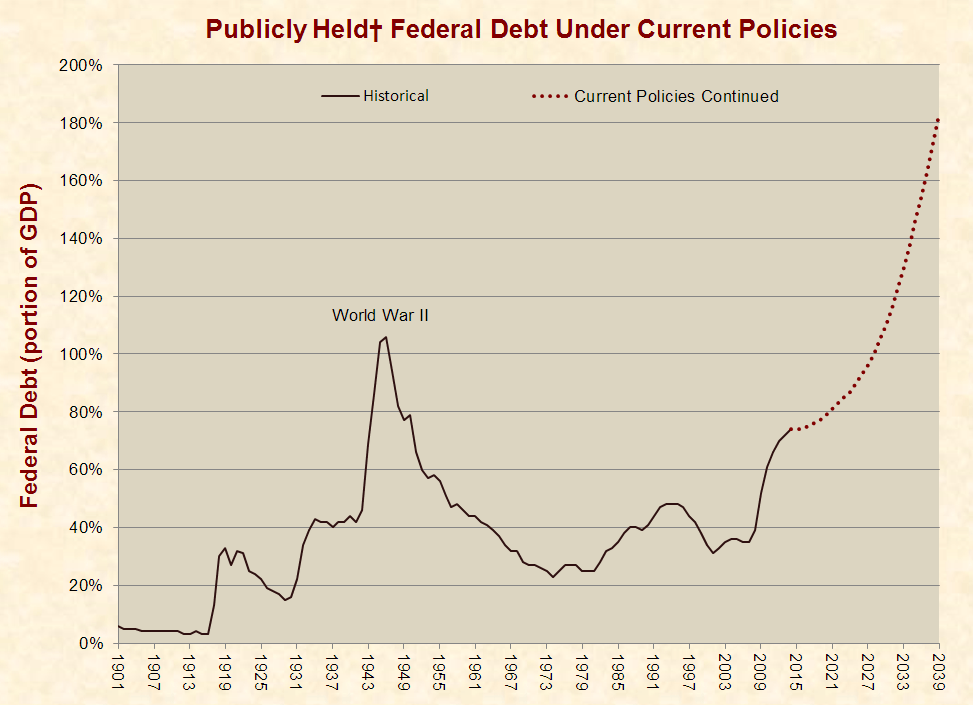
 Unlike the debt from World War II—which rapidly declined after the war ended—the current national debt is escalating. Between 2007 and 2014, the publicly held federal debt (the major portion of the national debt) more than doubled. In 2014, the Congressional Budget Office (CBO) projected that this debt would more than double again over the next 25 years and far exceed the peak of World War II. Three years later, the debt is tracking with these projections:
 The Causes
Beyond dynamics like interest and inflation that affect debt which has already accumulated, the federal debt is ultimately caused by two basic factors: (1) spending and (2) taxes. All other things being equal, increased spending raises the national debt, and increased tax receipts decrease the national debt.
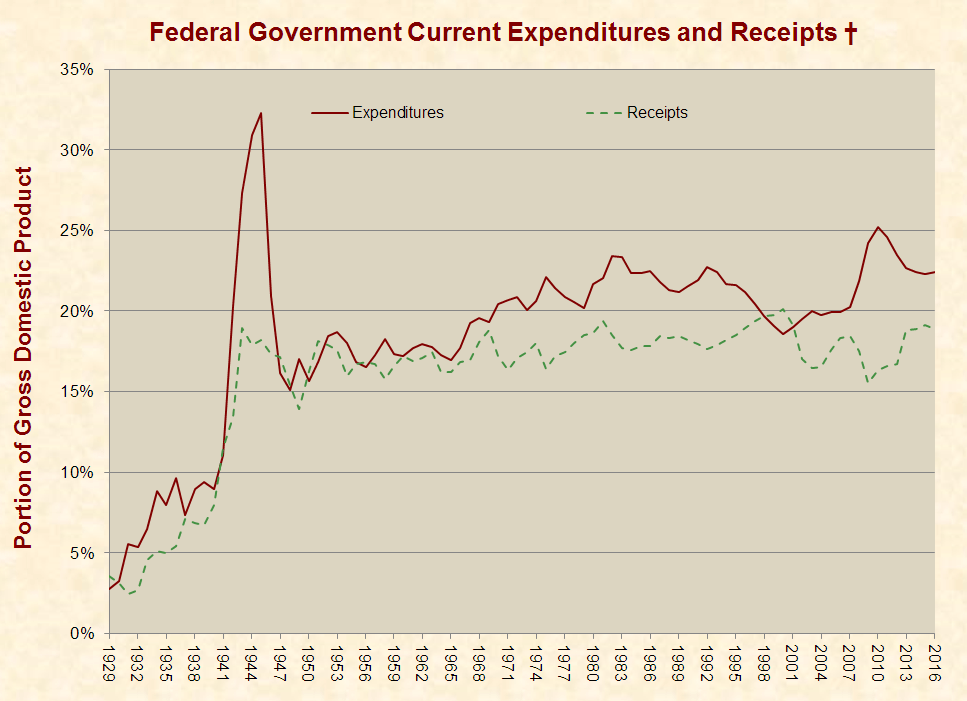
As a portion of GDP, federal taxes and spending rose steeply between 1930 and World War II. Since then, taxes have risen slightly, but spending has risen more:
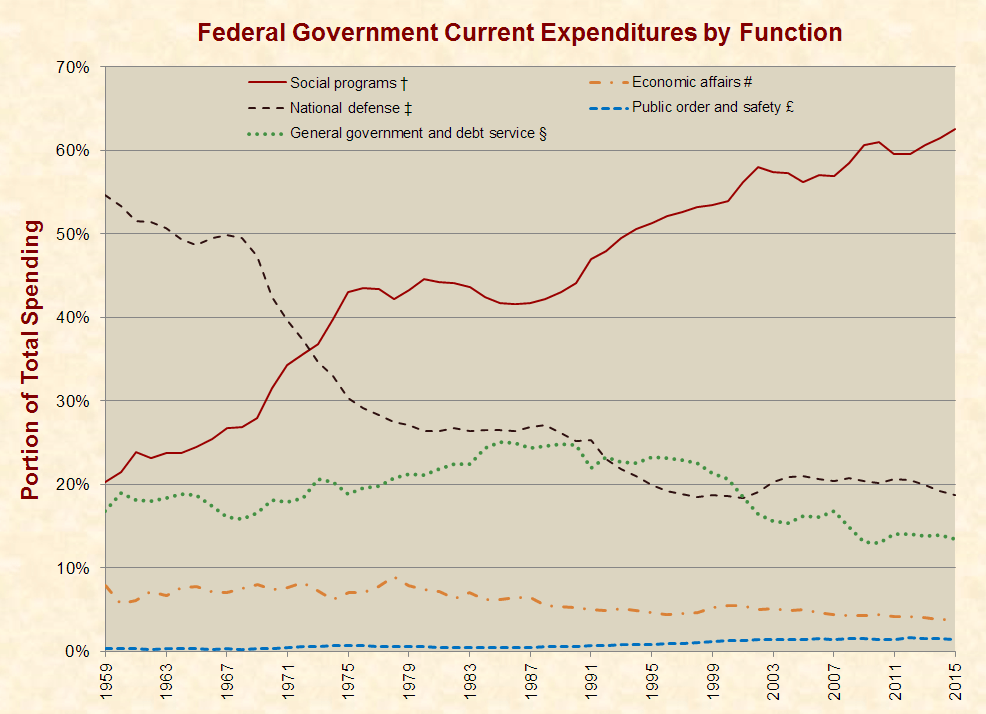
 Since 1959, the composition of federal spending has changed dramatically. Spending on social programs (like income security, healthcare, education, and housing) has risen from 21% of the federal budget to 63%. In contrast, spending on national defense has fallen from 53% to 19%:
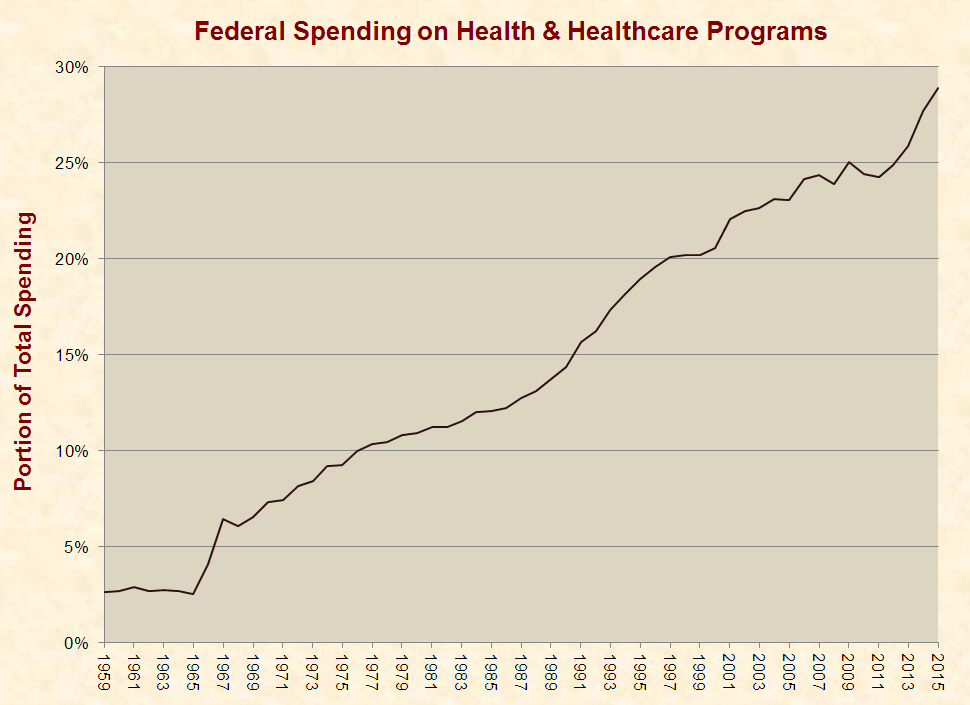
 Much of this increased spending is the result of healthcare programs that policymakers have enacted since the 1960s. Between 1959 and 2015, federal spending on health and healthcare programs rose from 3% of total federal spending to 29%:
 Politicians, reporters, and activists have often blamed the national debt on factors like military spending, tax cuts, and foreign aid, but the hard data shows that the primary driver of the national debt is soaring spending on social programs.
The Repercussions
Large national debts can harm people in ways that are not always obvious to the general public. For example, federal debt can lower labor productivity, which is the primary driver of living standards. This occurs because government debt generally diverts money away from investments in technologies, equipment, and structures that increase productivity.
As explained by CBO, when “people hold their wealth as government bonds rather than in a form that can be used to finance private investment, the increased debt will tend to reduce the stock of productive private capital.” This same mechanism lowers “aggregate wages,” or the total wages earned by Americans.
Productivity is also a key driver of GDP, which is determined by the equation Hours worked × Labor productivity. Per the textbook Microeconomics for Today, countries with low GDP growth “are less able to satisfy basic needs for food, shelter, clothing, education, and health.”
Contrary to what many journalists and pundits have alleged, there is a strong association between government debt and poor economic progress. Numerous media outlets have publicized a study said to disprove this connection, but the study actually shows what previous studies had found: GDP growth decreases by an average of about 30% when government debt exceeds 90% of an economy. The authors of this study, however, buried this data on the 10th page of their paper and wrote a deceitful overview, which the media parroted.
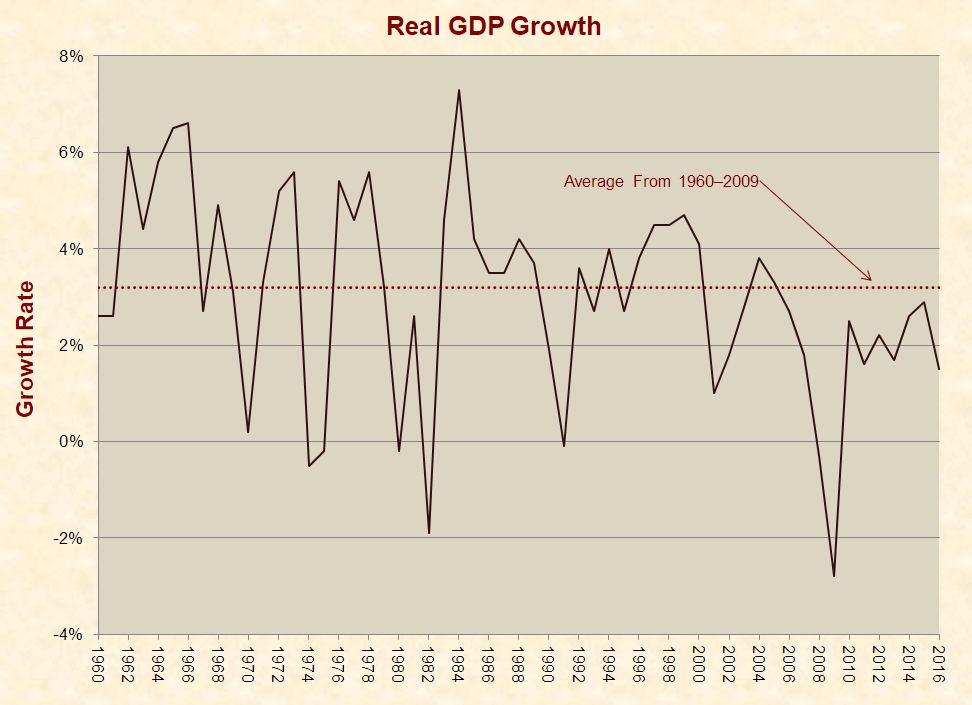
Ever since the U.S. national debt exceeded 90% of GDP in 2010, inflation-adjusted average GDP growth has been 33% below the average from 1960–2009, a period that included eight recessions:
 This subpar economic growth accords perfectly with the results of a 2012 paper about government debt in the Journal of Economic Perspectives. Using 2,000+ data points on national debt and economic growth in 20 advanced economies, the study found that nations with national debts above 90% of GDP averaged 34% less real annual economic growth than when their debts were below 90% of GDP.
This weak GDP growth over the past seven years is especially troublesome given that the U.S. economy typically performs well in the wake of recessions—and the deeper the recession, the better the performance. In fact, renowned liberal economist Paul Krugman once argued that “the economic expansion under President Reagan did not validate his economic doctrine,” because “rapid growth is normal when an economy is bouncing back from a deep slump.”
It is important to realize that association does not prove causation, and it is often difficult to determine causation in economics and other social sciences. This is because numerous variables might affect a certain outcome, and there is frequently no objective way to identify all of these factors and isolate the interplay between them.
However, when it comes to government debt, a wide array of facts and data from numerous countries suggest that large national debts can harm economic growth. This is not a definitive conclusion but a strong likelihood.
The consequences of government debt can manifest in many different ways, but as the U.S. Government Accountability Office has explained, “Over the long term, the costs of federal borrowing will be borne by tomorrow’s workers and taxpayers” and “ultimately may reduce or slow the growth of the living standards of future generations.”
With regard to stabilizing or reducing the debt, CBO’s 2010 and 2014 long-term budget outlooks state that postponing action will:
- punish younger generations of Americans, because most of the burden would fall on them.
- reward older generations of Americans, because “they would partly or entirely avoid the policy changes needed to stabilize the debt.”
- “substantially increase the size of the policy adjustments needed to put the budget on a sustainable course.”
All told, the repercussions of the national debt can be quickly summarized in the words of the prolific economist William A. McEachern:
You may have heard the expression “There is no such thing as a free lunch.” There is no free lunch because all goods and services involve a cost to someone. The lunch may seem free to you, but it draws scarce resources away from the production of other goods and services, and whoever provides a free lunch often expects something in return. A Russian proverb makes a similar point but with a bit more bite: “The only place you find free cheese is in a mousetrap.”


I’ve been following our Demise to Debtors prison for nearly 10 years. There are manipulations and manipulators. Those Ponzi players are driving our nation to bankruptcy BUT as the article states, the debt will be left to future generations and those causing it will be long dead. It kind of sounds like the midnight deals done in Chicago!
Do younger citizens and taxpayers understand the massive debt that they are facing over their lives?
Thanks, Jim!! – Should be very enlightening for a number of people I know! Keep up the great work!
Two questions…
First, what is the true debt if one follows the same calculations as former Treasury Secretary O’Neil had Gukhale (I believe I spelled that right} calculate years ago under the Bush administration (I believe the number would be over 100 Trillion as of today)?
Second, a child born today would have how much Federal debt as of his 21st birthday? Thanks, Steve
From another perspective, if you could save $100/second, in order to accumulate $1 Trillion, it would take you 317 years to do so.