
Treasury Data Reveals Federal Shortfall of $614,000 per U.S. Household
By James D. Agresti
March 4, 2016
Newly published data from the U.S. Treasury shows that the federal government has amassed $76.4 trillion in debts, liabilities, and unfunded Social Security and Medicare obligations. This amounts to $614,000 for every household in the U.S., a burden that equals 90% of the nation’s private wealth, including the combined value of every American’s assets in real estate, corporate stocks, small businesses, bonds, savings accounts, cash, and personal goods like automobiles and furniture.
Federal law requires the U.S. Treasury and White House to produce an annual report on the “overall financial position” of the federal government. The law also requires the Government Accountability Office to audit the data, which is then published in the Financial Report of the United States Government.
Unlike the federal budget, which primarily uses “cash accounting,” this report uses “accrual accounting.” The Government Accountability Office explains that this accounting method “is intended to provide a complete picture of the federal government’s financial operations and financial position.”
Cash accounting is the simple process of counting money as it flows in or out. In contrast, accrual accounting measures financial commitments when they are made. For example, as federal workers earn pension benefits, accrual accounting measures these obligations in the year that they are earned. Cash accounting does not measure such liabilities until they are paid, which may not be until years or decades later.
The federal government requires large corporations to use accrual accounting for their pension plans, because this is the “most relevant and reliable” way to measure their financial health. The same applies to other retirement benefits like healthcare. The official statement of this rule explains that “a failure to accrue” implies “that no obligation exists prior to the payment of benefits.” Since an obligation does exist, failing to account for it “impairs the usefulness and integrity” of financial statements.
Nonetheless, the federal budget, which is the “government’s primary financial planning and control tool,” is not bound by the accounting rules that the government imposes on the private sector. In the words of the U.S. Treasury, the federal budget is prepared “primarily on a ‘cash basis’.”
This has major implications for future taxpayers, partly because pension and other retirement benefits are a large part of compensation packages for federal employees. When these benefits are included, civilian, non-postal federal employees receive an average of 16% more in compensation than private-sector workers with comparable education and work experience. Postal workers receive an even greater premium.
The recently released Treasury report shows that the federal government currently owes $6.7 trillion in pensions and other benefits to federal employees and veterans. Paying the present value of these benefits would require an average of $54,000 from every household in the U.S. Yet these liabilities are not reflected in the current federal budget or publicly held national debt.
A similar situation exists with Social Security and Medicare, because the government primarily funds the current expenses of these programs with taxes from workers who don’t receive benefits until they become senior citizens. Hence, Social Security and Medicare are sometimes called “pay-as-you-go” programs.
Once again, this is different from the private sector, where “federal law requires that private pension plans operate as funded plans, not as pay-as-you-go plans.” As explained by the American Academy of Actuaries, the law requires private pension plans to pay for “benefits as they are earned” to ensure “intergenerational equity.” In other words, the law prevents older workers from placing the costs of their retirements on younger workers, at least in the private sector.
Social Security and Medicare differ from pensions, because taxpayers don’t have a contractual right to receive these benefits. In the original Social Security Act of 1935, Congress “reserved” the “right to alter, amend, or repeal any provision of this Act.” Consequently, the Supreme Court ruled in 1960 that Congress can change Social Security benefits at will. Nevertheless, paying these benefits is an implied commitment of the federal government, and the law requires that these programs be included in the Financial Report of the U.S. Government.
Federal actuaries measure the obligations of Social Security and Medicare in several different ways, but only one of them approximates the concept of accrual accounting. This is called the “closed-group” obligation, which is the money needed to cover the shortfalls for all current taxpayers and beneficiaries in these programs. In the words of Harvard Law School professor and federal budget specialist Howell E. Jackson, the closed-group measure “reflects the financial burden or liability being passed on to future generations.” These burdens amount to $26.7 trillion for Social Security and $28.5 trillion for Medicare.
The Treasury report includes other obligations of the federal government, like environmental liabilities and accounts payable. The report also accounts for federal assets, such as cash, real estate, and corporate stocks. This excludes federal stewardship land and heritage assets, such as national parks and the original copy of the Declaration of Independence. While these items have tangible value, the report explains that the government “does not expect to use these assets to meet its obligations.”
Tallying the Treasury’s data on assets and subtracting its obligations shows that the federal government has a fiscal shortfall of $76.4 trillion in debts, liabilities, and unfunded Social Security/Medicare obligations. Divided evenly across all U.S. households, this amounts to an average of $614,000 per household.
The actual shortfall may be worse, because the Treasury data is based on certain assumptions made by the federal government that are highly uncertain and optimistic. For example:
- A paper in the journal Demography found that the Social Security Administration is using an antiquated method to project life expectancies, and as a result, the program “may be in a considerably more precarious position than officially thought.”
- When the federal government makes student loans, it projects that it will eventually reap a 9% average profit from interest on the loans. However, the Congressional Budget Office has determined that if the federal government accounted for the market risk of these loans, it would show an average loss of 12% on every dollar it lends.
- The Board of Medicare Trustees has stated that the program’s long-term costs may be “substantially higher” than projected under current law. This is because the Affordable Care Act (i.e., Obamacare) will cut Medicare prices for “many” healthcare services to “less than half of their level” under prior law. The Trustees explain that this may cause “withdrawal of providers from the Medicare market” and “severe problems with beneficiary access to care.” This would pressure lawmakers to raise prices and thus increase the costs of Medicare.
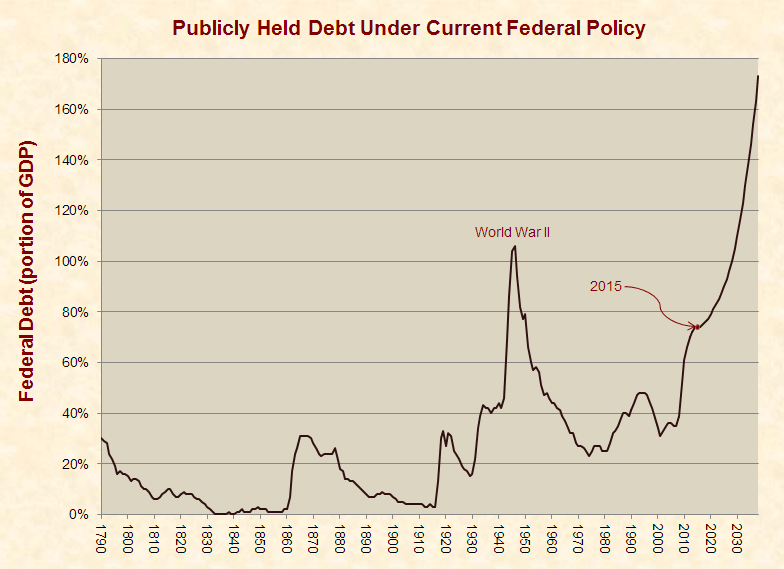
The current national debt is $19.1 trillion. This amounts to 105% of the nation’s gross domestic product, which is higher than any point in U.S. history except for two years near the end of World War II. The national debt, however, is mainly measured on a cash basis, and as such, it does not include most of the obligations detailed above.
These obligations are looming, and their consequences can be seen in the Congressional Budget Office’s projections of publicly held debt (a partial measure of national debt). Under current federal policies and their economic effects, the Congressional Budget Office projects that the next generation of Americans will inherit a debt like never before seen in the history of the U.S.:
 The vast bulk of current and impending federal debt is due to increased spending on social programs like Medicare, Social Security, Medicaid, and food stamps. Such programs have grown from 20% of federal spending in 1960 to 61% of federal spending in 2014. Under current laws and policies, the Congressional Budget Office projects that most future growth in spending will be due to Social Security, Medicare, Medicaid, the Children’s Health Insurance Program, Obamacare, and interest on the national debt.
An ideologically diverse array of economists and other scholars have found that present and future levels of government debt threaten far-reaching negative consequences, such as lower wages, weak economic growth, increased inflation, higher taxes, reduced government benefits, or combinations of such results. As summarized by the Government Accountability Office, “the costs of federal borrowing will be borne by tomorrow’s workers and taxpayers,” and this “may reduce or slow the growth of the living standards of future generations.”


Is it factual that FICA income no longer fully covers social security payouts to retirees and that funds to cover SS payouts are being covered by other budget sources ?
Yes, since 2010, FICA taxes have no longer fully covered Social Security payouts. However, the shortfall is being paid from the Social Security Trust Fund. Documentation and more details are available here.
my understanding of the SS Trust Fund is…that the fund consists of ‘special bonds’ approved by congress and issued thru the Treasury Dept…however as the US finds itself in 19.1 triilion dollars debt…and 10’s of trillions in Unfunded National Debt Liabilities (including trillions already owed to Social Security)…that the likelihood that these bonds can be fulfilled is … frankly unlikely….that SS currently survives much like a PONZI scheme…benefits are paid thru tax withholdings…when those dollars evaporate each year…congress authorizes more national debt to pay the shortfall….there are a lot more SS recipients of benefits than taxpayers paycheck withholdings to supply the benefits. In the short form SS is mostly dead.
Some of your numbers for unfunded liabilities seem too low. For example, in the 2016 Social Security Annual Report for 2015, they show $32.1 TRILLION NET, not $26.7 TRILLION as you state. So that is a difference of $5.4 TRILLION.
Furthermore, various analysts think that Social Security’s estimates are too optimistic, and in fact, the numbers for unfunded liabilities, the date until reserves are exhausted, etc. are really even worse than what they claim. For many years, they often have been wrong in the same direction.
One example analysis was the 2015 Harvard-Dartmouth report that is described in this article. It does not even cover many of the problems that make matters even much worse: http://www.forbes.com/sites/janetnovack/2015/05/08/harvard-study-social-security-in-far-worse-shape-than-official-numbersshow/#5282ec1143cc
Please advise.
Thank you.
There are a number of different ways to determine unfunded liabilities and obligations. In keeping with Just Facts’ Standards of Credibility, we used the most conservative plausible ones. In this case, these are the closed-group unfunded obligations provided in the Social Security and Medicare Trustee reports. For more details on how these are calculated and what they mean, see our research on Social Security and Medicare.
He leaves out how the increase in the military budget has changed the numbers